We absolutely love LINQ to SQL here at Compsoft. It's the best ORM we've used and it's made a marked speed increase in both our application development and application performance.
A concern we had initially was the amount of "magic" involved. Occasionally we'd find that LINQ was running rather more queries than we'd expected (the DataLoadOptions weren't always behaving quite as we'd anticipated), or the queries were unexpectedly complicated. Also, with all the ease of data access that LINQ gives you, it's easy to get lazy and forget quite how many trips you're making to the database to generate a single web page.
We felt we needed an easy way to see what was going on under the hood. We didn't want to have to go a long way out of our way to find out which pages took a lot of database effort: we wanted to be warned about this up-front.
So here's what we made: when in debug mode, this appears in the top corner of every page we're working on:

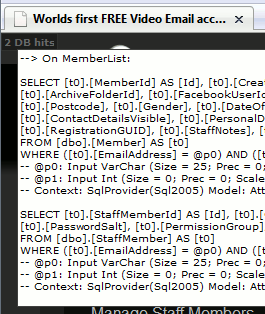
... which expands to this when clicked:

The more queries it takes to make the page, the redder the little "DB hits" box appears, drawing our attention to pages that accidentally take a lot of work to produce.
LINQ to SQL makes it easy to capture this sort of information. The Log property of DataContext is a TextWriter to which all queries are written, together with the values of any query parameters. Setting this to a new StringWriter in the constructor of our application's DataContext catches all the queries it performs.
We typically use one DataContext per page lifecycle, so it would seem it would be sufficient to dump the contents of the log to the page late in the page lifecycle. However there are occasions where we create additional DataContexts for particular tasks, and we want to know what they are up to too.
Here's the solution we came up with:
The data context class for the application inherits from this BaseDataContext class, which lives in our reusable code libraries:
// codesnippet:4963E640-80C0-4577-A2B2-F0F6A8D41E56
public class BaseDataContext : DataContext
{
#if (DEBUG)
private static TextWriter logWriter;
private static StringBuilder _Logger;
public static StringBuilder Logger
{
get { return _Logger; }
set
{
_Logger = value;
logWriter = new StringWriter(value);
}
}
static BaseDataContext()
{
BaseDataContext.Logger =
new StringBuilder();
}
#endif
public BaseDataContext(string connectionString)
: base(connectionString)
{
#if (DEBUG)
this.Log = logWriter;
#endif
}
[Aside: we like Jeff Attwood's idea for flagging code snippets with GUIDs.]
As you can see, the log is static, so all queries from all DataContexts will be written to the same log. This would be nightmarish if the server were handling numerous requests concurrently, but this is just a development tool for when the application is running on your local machine (which is partly why the logging only happens when the application's in debug mode).
That takes care of logging the queries; next we have to display them. We have this in the class that all our pages inherit from:
#if (DEBUG)
protected override void Render(HtmlTextWriter writer)
{
// Snip - write the contents of the log
// to the page
base.Render(writer);
BaseDataContext.Logger = new StringBuilder();
}
#endif
This ensures the log is cleared down right at the very end of the page lifecycle, ready to start logging queries for the next page. Also, as the log is only cleared after it's written out, no queries get lost if the page lifecycle ends prematurely in a redirect.
The snipped code is a bit lengthy, but it basically renders the database hit count with a little jQuery to expand the full details of the queries when clicked, as in the screenshots above.
Astonishingly you can't do this sort of thing at all in LINQ to Entities - it doesn't have this logging support - so for all the flexibility that it offers, it's still missing some features that seem pretty crucial to us.

